-2.png)
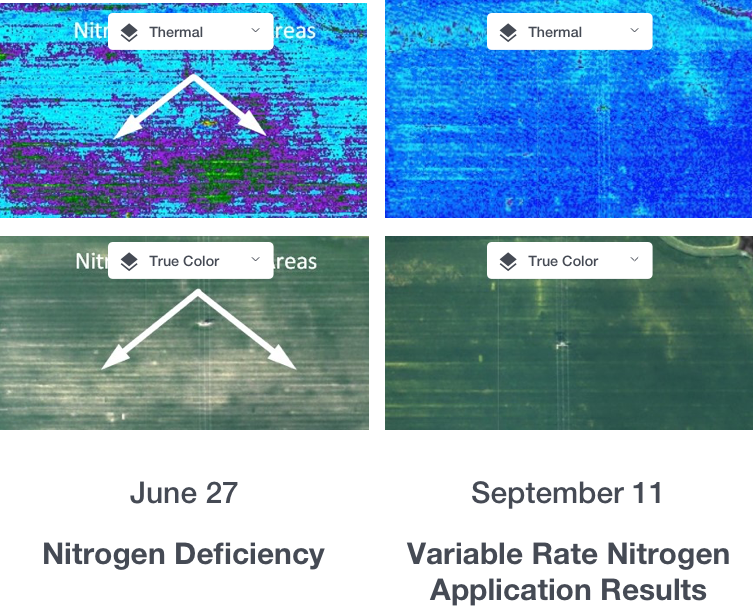
Nitrogen Deficiency & Variable Rate Nitrogen Application
In this example, the grower identified a low growth area from a June image (left), which alerted him to a nitrogen deficiency. Having quantified the nitrogen-deficient areas, the grower decided to make a variable rate nitrogen application, targeting the deficient areas with a higher rate. The September 11 image (right) shows that the nitrogen application was successful in creating uniform growth throughout the field two and a half months later.
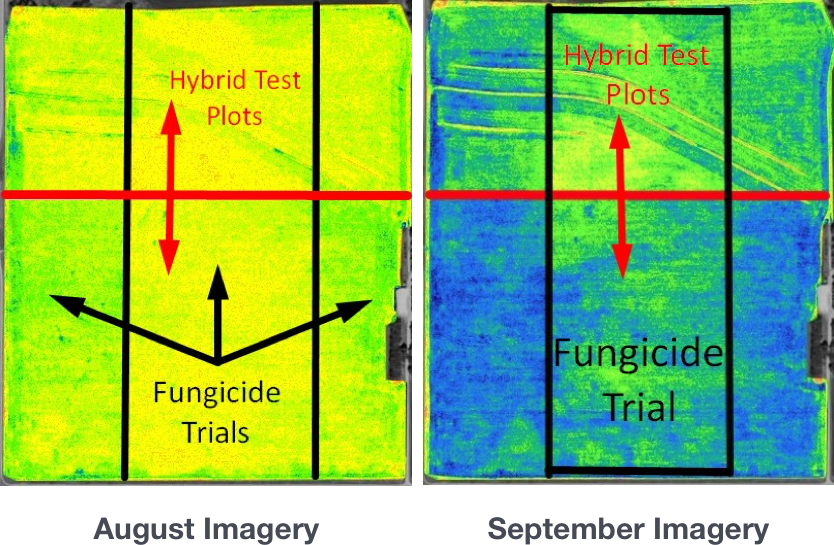
Hybrid and Fungicide Trials
In this example, the grower planted different corn hybrids in the north and south part of his field, and conducted three fungicide trials in the left, center and right zones of his field. The August 22 image shows that the top hybrid and center fungicide treatment are the most vigorous. The September 17 imagery shows that this trend continues to hold a month later. With NDVI imagery, the growers was able to compare the performance of the hybrids and fungicides.
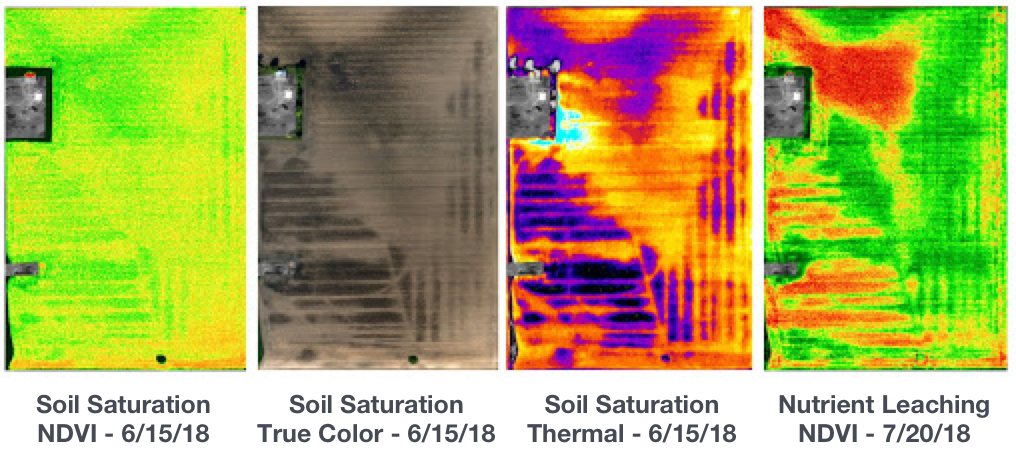
Soil Saturation & Nutrient Leaching
The images above show a field that has experienced nutrient leaching due to poor tiling and heavy rains. The red, orange, and yellow in the image indicate stressed zones of the field where the crop may be experiencing nutrient deficiency.

During your demo Ryan from the FarmLogs team
will answer any questions you have.
will answer any questions you have.